Edit chart
Loading graph
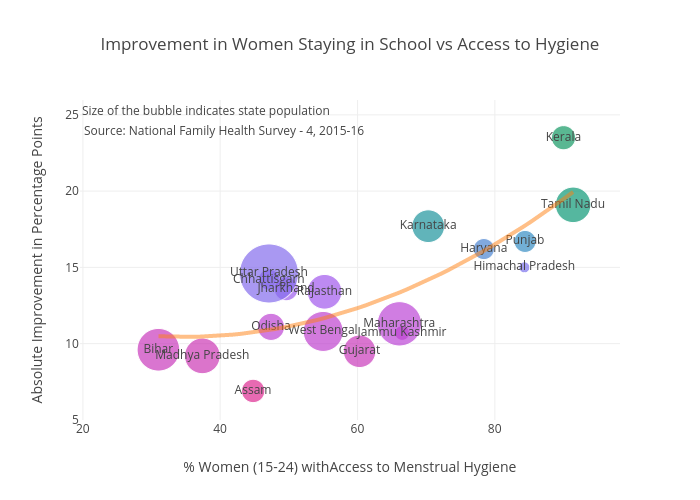
Nilakar's interactive graph and data of "Improvement in Women Staying in School vs Access to Hygiene" is a , showing Absolute Improvement in Percentage Points; with % Women (15-24) withAccess to Menstrual Hygiene in the x-axis and Absolute Improvement in Percentage Points in the y-axis.. The x-axis shows values from 24.97545970467101 to 97.02148709979893. The y-axis shows values from 4.955370482936383 to 26.000329492823536. This visualization has the following annotations: Source: National Family Health Survey - 4, 2015-16; Size of the bubble indicates state population