Edit chart
Loading graph
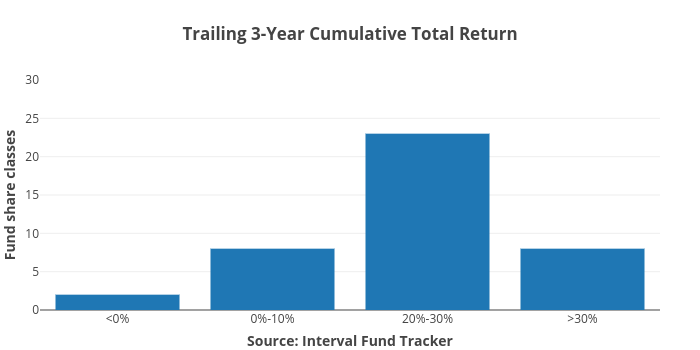
Ockhamdata's interactive graph and data of "Trailing 3-Year Cumulative Total Return" is a bar chart, showing Performance; with Source: Interval Fund Tracker in the x-axis and Fund share classes in the y-axis.. The x-axis shows values from -0.5 to 3.5. The y-axis shows values from 0 to 30.