Edit chart
Loading graph
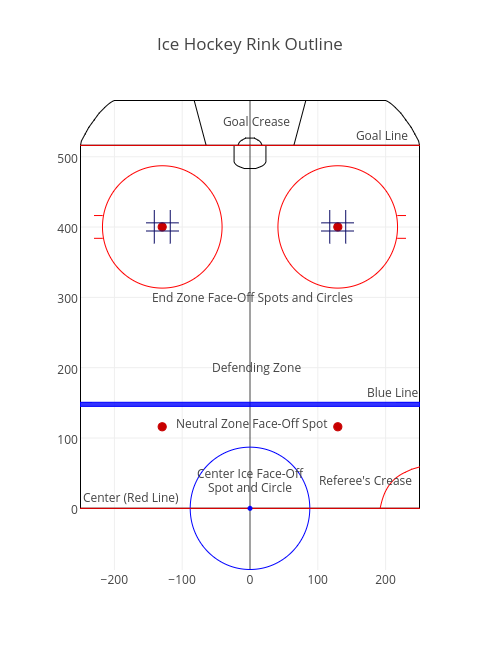
Octogrid's interactive graph and data of "Ice Hockey Rink Outline" is a scatter chart. The x-axis shows values from -250.73746312684366 to 250.73746312684366. The y-axis shows values from -87.71108742004265 to 580.7110874200426. This visualization has the following annotations: Goal Crease; Blue Line; Goal Line; Center (Red Line); Center Ice Face-Off; Spot and Circle; Neutral Zone Face-Off Spot; Defending Zone; End Zone Face-Off Spots and Circles; Referee's Crease