Edit chart
Loading graph
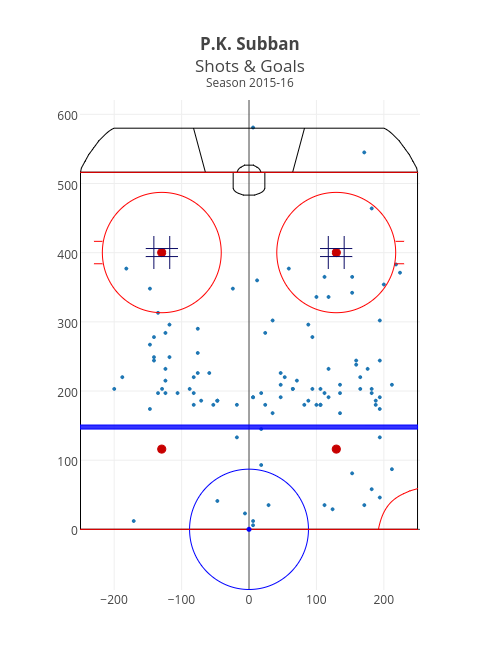
Octogrid's interactive graph and data of "P.K. SubbanShots & GoalsSeason 2015-16" is a scatter chart. The x-axis shows values from -250.7417840375587 to 253.67136150234742. The y-axis shows values from -87.72294372294373 to 620.7619047619048.