Edit chart
Loading graph
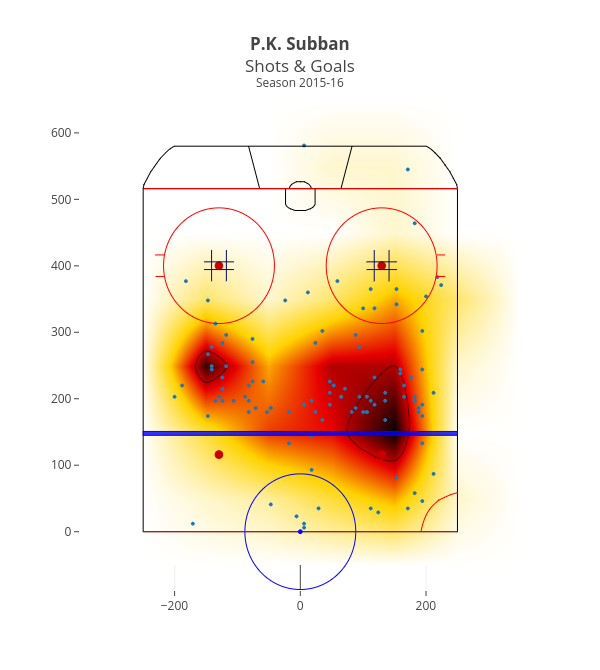
Octogrid's interactive graph and data of "P.K. SubbanShots & GoalsSeason 2015-16" is a scatter chart, showing density. The x-axis shows values from -350.5 to 349.5. The y-axis shows values from -87.75229826353421 to 649.5.