Edit chart
Loading graph
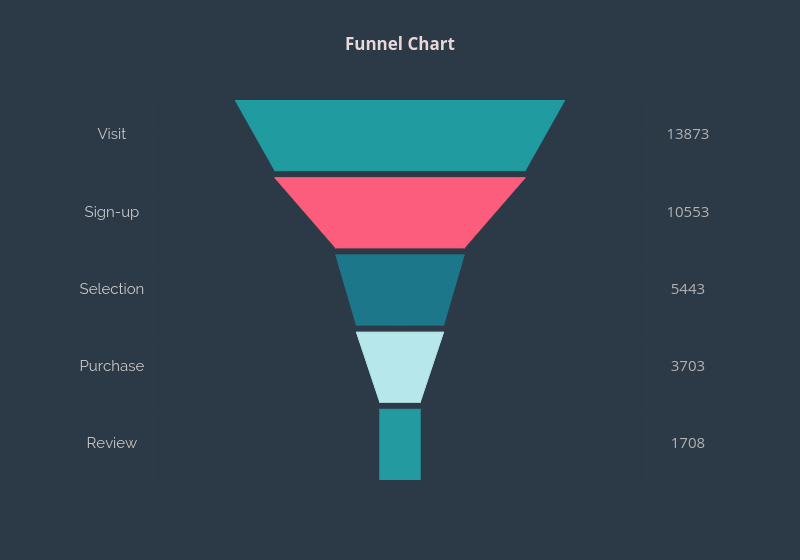
Octogrid's interactive graph and data of "Funnel Chart" is a . The x-axis shows values from -388.8888888888889 to 388.8888888888889. The y-axis shows values from -0.712401055408971 to 540.7124010554089.