Edit chart
Loading graph
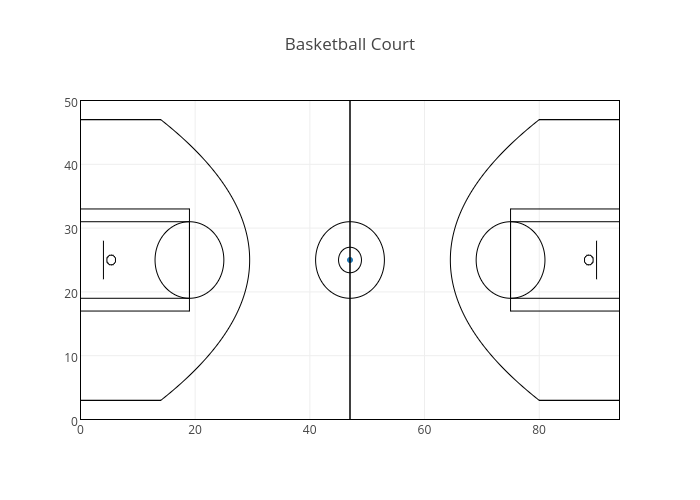
Octogrid's interactive graph and data of "Basketball Court" is a scatter chart. The x-axis shows values from -0.06143790849673202 to 94.06143790849673. The y-axis shows values from -0.07374631268436578 to 50.073746312684364.