Edit chart
Loading graph
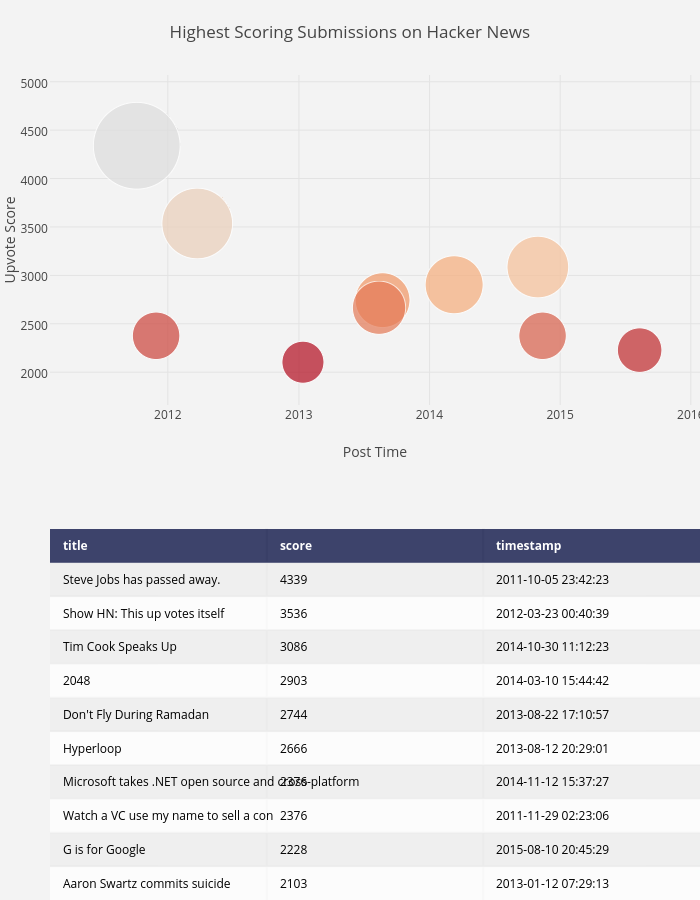
Octogrid's interactive graph and data of "Highest Scoring Submissions on Hacker News" is a heatmap. The x-axis shows values from 0 to 0. The y-axis shows values from 0 to 0. This visualization has the following annotations: title; score; timestamp; Steve Jobs has passed away.; 4339; 2011-10-05 23:42:23; Show HN: This up votes itself; 3536; 2012-03-23 00:40:39; Tim Cook Speaks Up; 3086; 2014-10-30 11:12:23; 2048; 2903; 2014-03-10 15:44:42; Don't Fly During Ramadan; 2744; 2013-08-22 17:10:57; Hyperloop; 2666; 2013-08-12 20:29:01; Microsoft takes .NET open source and cross-platform; 2376; 2014-11-12 15:37:27; Watch a VC use my name to sell a con; 2376; 2011-11-29 02:23:06; G is for Google; 2228; 2015-08-10 20:45:29; Aaron Swartz commits suicide; 2103; 2013-01-12 07:29:13