Edit chart
Loading graph
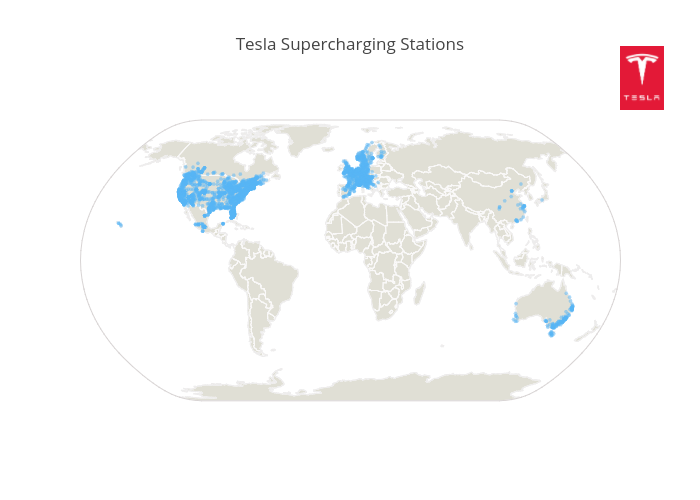
Octogrid's interactive graph and data of "Tesla Supercharging Stations" is a scattergeo, showing longitude. The x-axis shows values from 0 to 0. The y-axis shows values from 0 to 0.