Edit chart
Loading graph
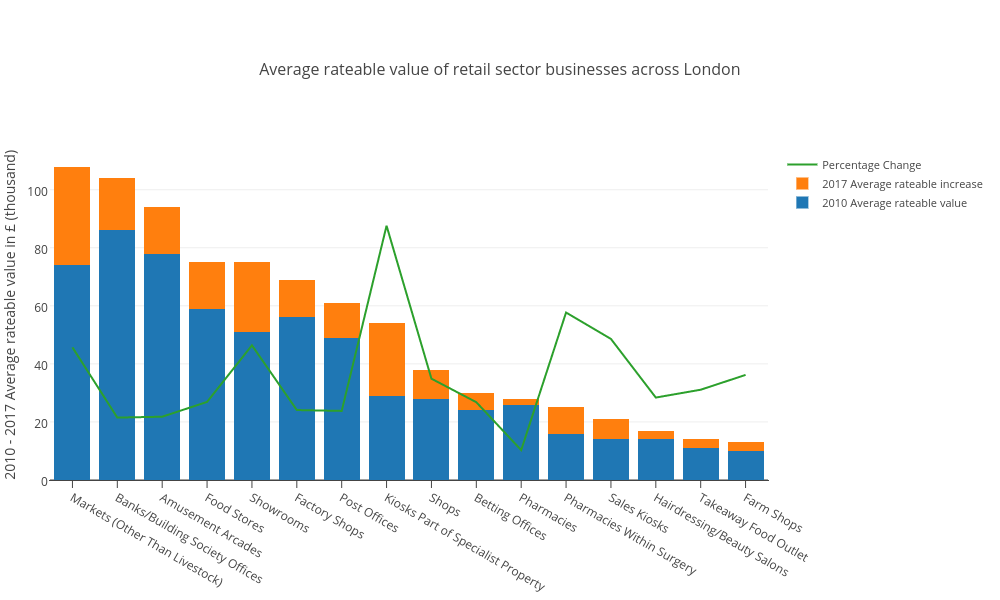
Oliverater's interactive graph and data of "Average rateable value of retail sector businesses across London" is a stacked bar chart, showing 2010 Average rateable value, 2017 Average rateable increase, Percentage Change; with 2010 - 2017 Average rateable value in £ (thousand) in the y-axis. The x-axis shows values from -0.5 to 15.5. The y-axis shows values from 0 to 113.6842105263158.