Edit chart
Loading graph
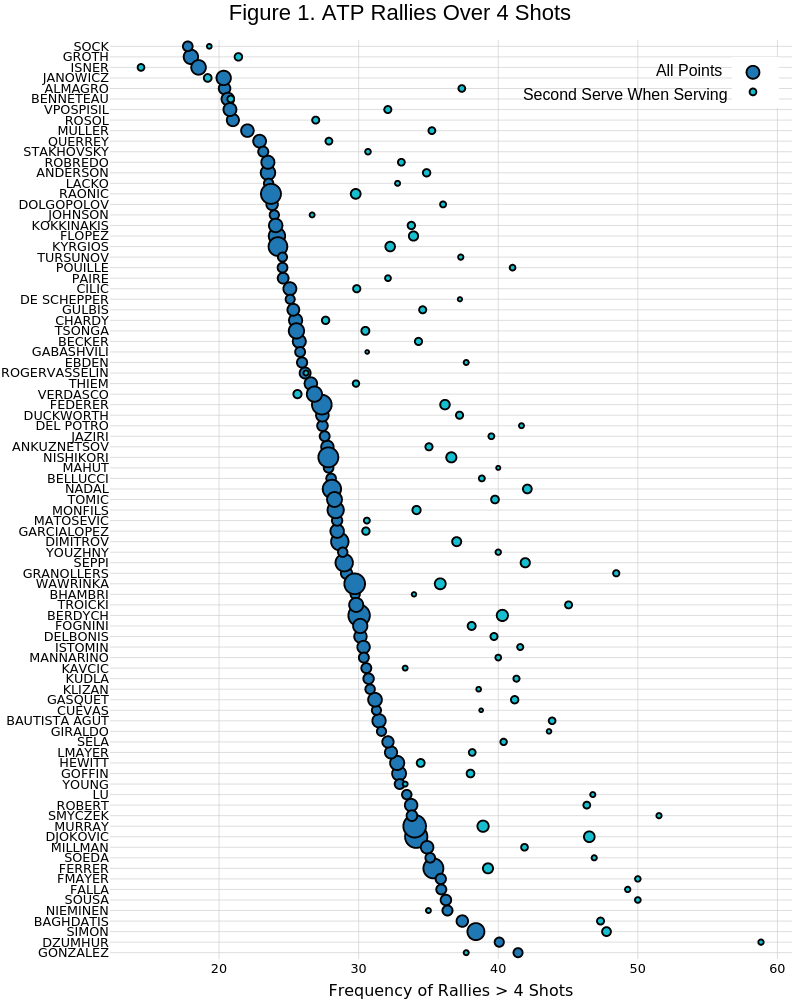
On-the-t's interactive graph and data of "Figure 1. ATP Rallies Over 4 Shots" is a scatter chart, showing vs ; with Frequency of Rallies > 4 Shots in the x-axis. The x-axis shows values from 12.1859421734796 to 61.0443668993021. The y-axis shows values from 0.4 to 87.6. This visualization has the following annotations: All Points; Second Serve When Serving