Edit chart
Loading graph
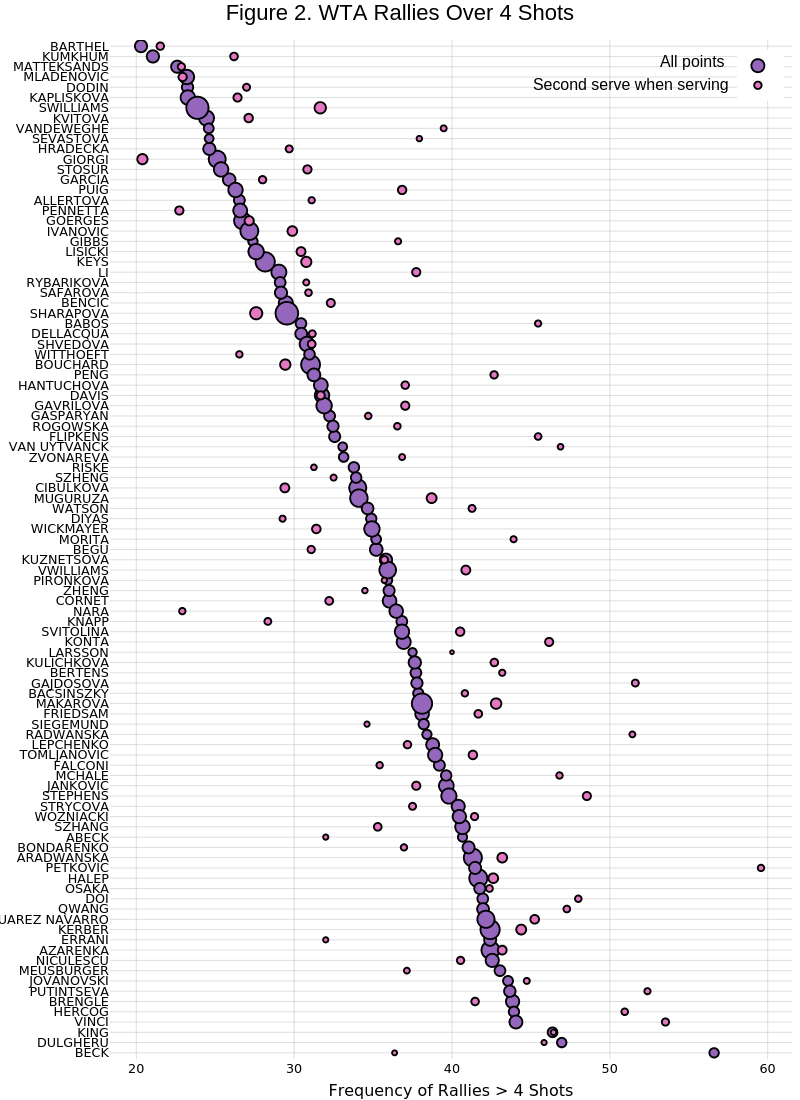
On-the-t's interactive graph and data of "Figure 2. WTA Rallies Over 4 Shots" is a scatter chart, showing vs ; with Frequency of Rallies > 4 Shots in the x-axis. The x-axis shows values from 18.3347094315656 to 61.5382661162274. The y-axis shows values from 0.4 to 99.6. This visualization has the following annotations: All points; Second serve when serving