Edit chart
Loading graph
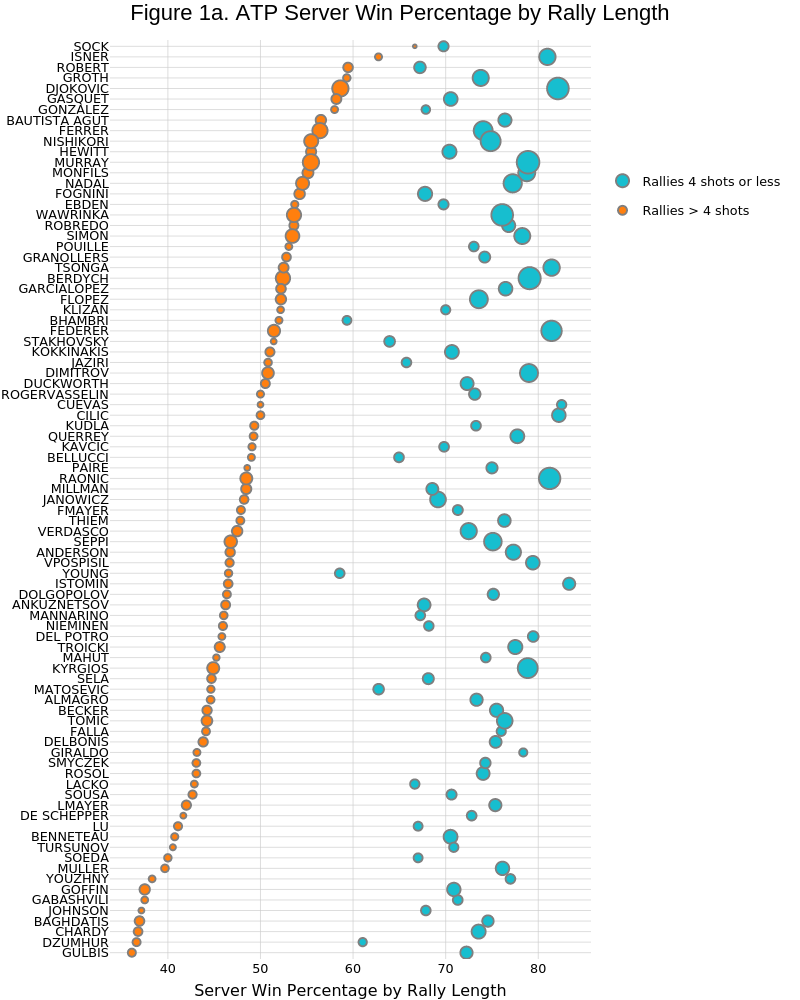
On-the-t's interactive graph and data of "Figure 1a. ATP Server Win Percentage by Rally Length" is a scatter chart, showing Rallies 4 shots or less vs Rallies > 4 shots; with Server Win Percentage by Rally Length in the x-axis. The x-axis shows values from 33.75 to 85.6944444444445. The y-axis shows values from 0.4 to 87.6.