Edit chart
Loading graph
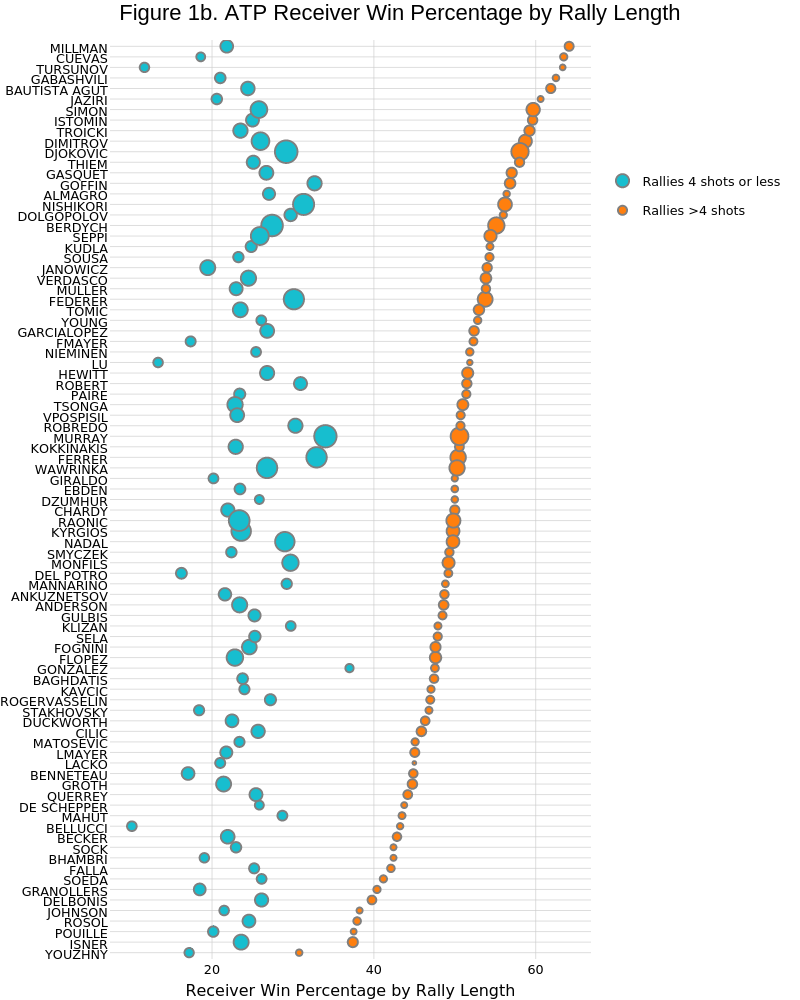
On-the-t's interactive graph and data of "Figure 1b. ATP Receiver Win Percentage by Rally Length" is a scatter chart, showing Rallies 4 shots or less vs Rallies >4 shots; with Receiver Win Percentage by Rally Length in the x-axis. The x-axis shows values from 7.38980853609892 to 66.8323693657758. The y-axis shows values from 0.4 to 87.6.