Edit chart
Loading graph
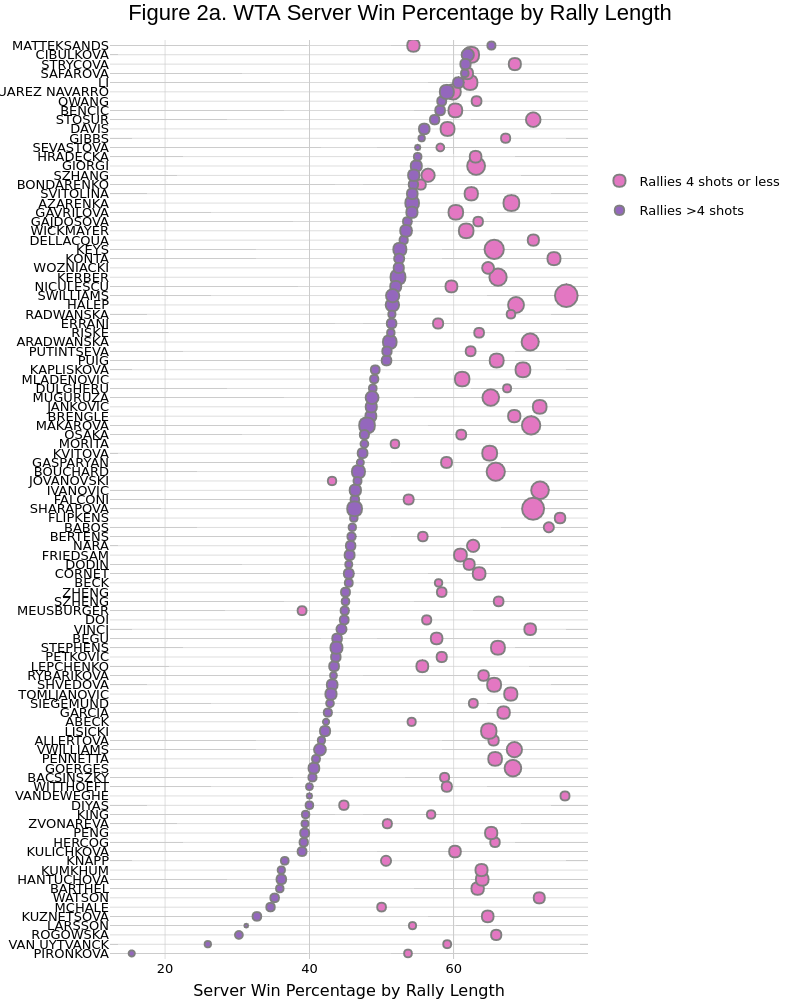
On-the-t's interactive graph and data of "Figure 2a. WTA Server Win Percentage by Rally Length" is a scatter chart, showing Rallies 4 shots or less vs Rallies >4 shots; with Server Win Percentage by Rally Length in the x-axis. The x-axis shows values from 12.3743848743849 to 78.5994560994561. The y-axis shows values from 0.4 to 99.6.