Edit chart
Loading graph
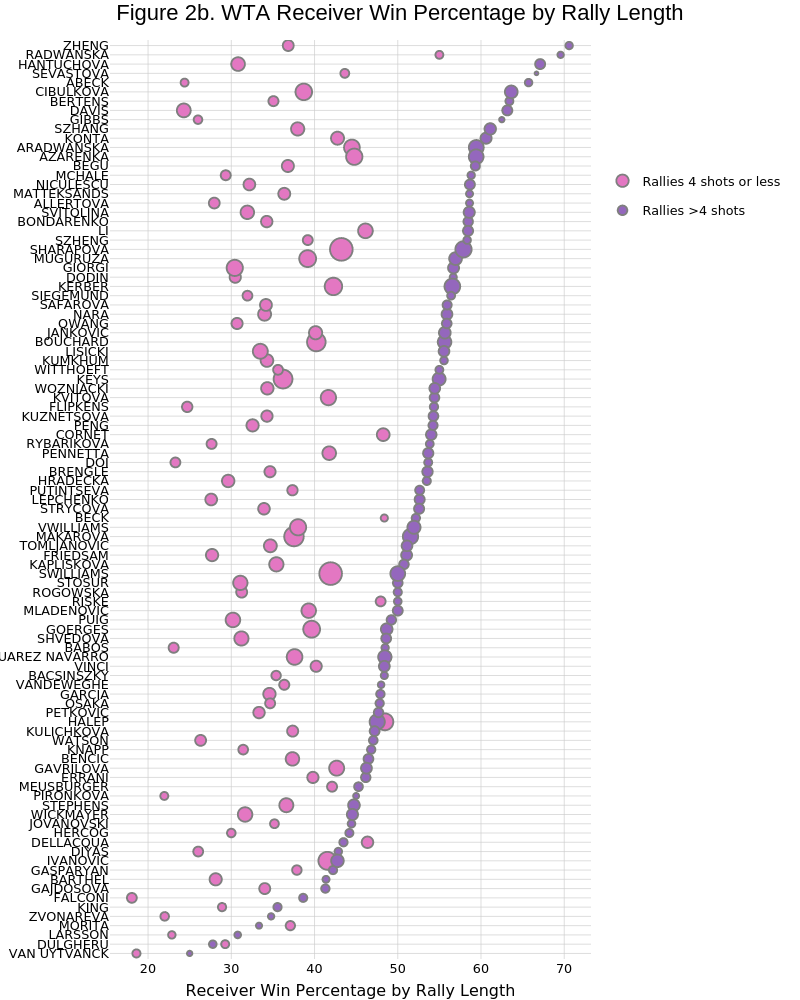
On-the-t's interactive graph and data of "Figure 2b. WTA Receiver Win Percentage by Rally Length" is a scatter chart, showing Rallies 4 shots or less vs Rallies >4 shots; with Receiver Win Percentage by Rally Length in the x-axis. The x-axis shows values from 15.4289215686274 to 73.2148692810458. The y-axis shows values from 0.4 to 99.6.