Edit chart
Loading graph
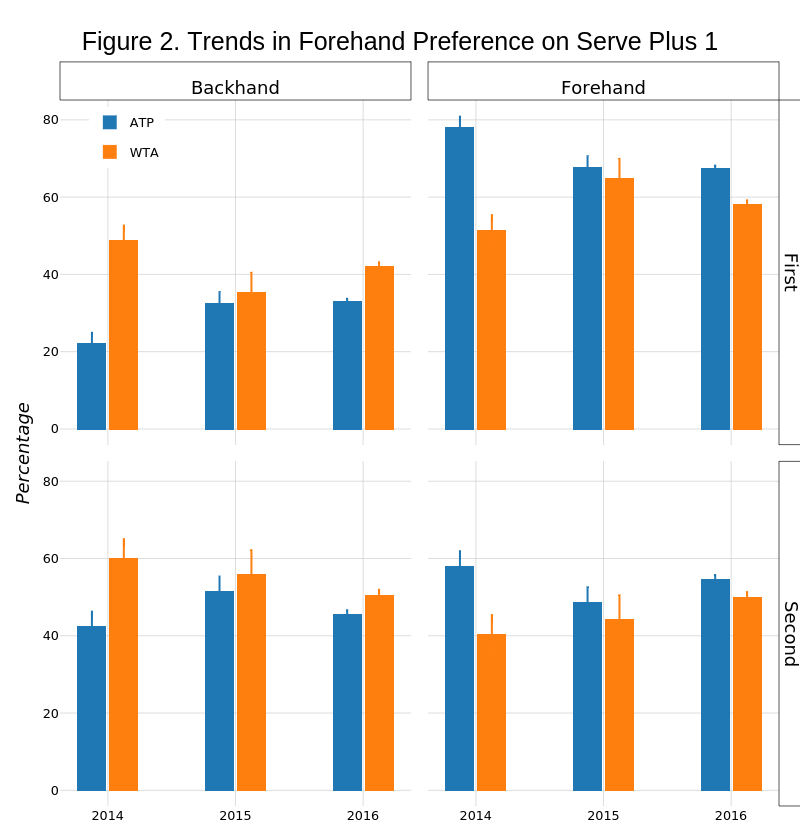
On-the-t's interactive graph and data of "Figure 2. Trends in Forehand Preference on Serve Plus 1" is a stacked bar chart, showing ATP, ATP, ATP, ATP, WTA, WTA, WTA, WTA, ATP, ATP, ATP, ATP, WTA, WTA, WTA, WTA. The x-axis shows values from 2013.625 to 2016.375. The y-axis shows values from -4.05407441460292 to 85.1355627066613. This visualization has the following annotations: Percentage ; Backhand; Forehand; First; Second