Edit chart
Loading graph
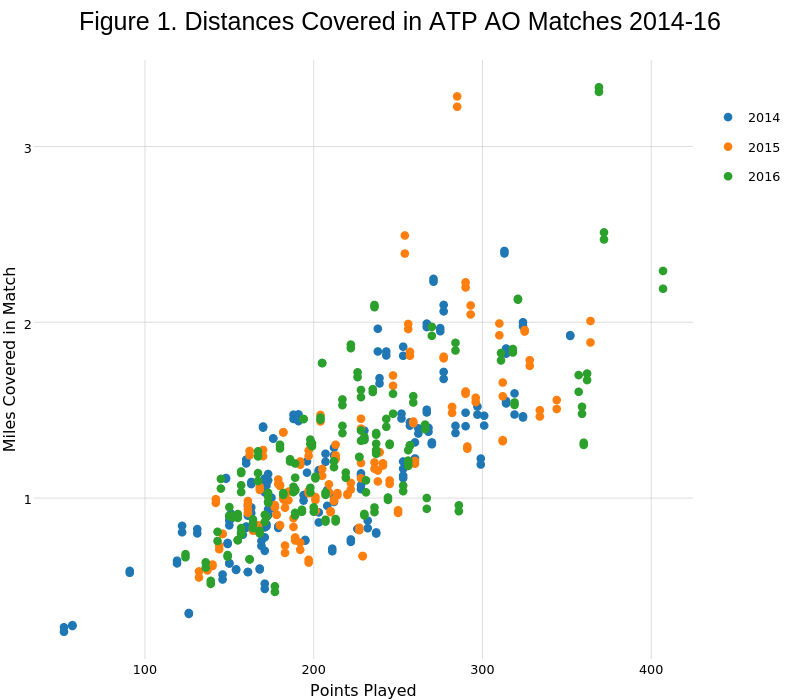
On-the-t's interactive graph and data of "Figure 1. Distances Covered in ATP AO Matches 2014-16" is a scatter chart, showing 2014, 2015, 2016, 2014, 2015, 2016; with Points Played in the x-axis and Miles Covered in Match in the y-axis.. The x-axis shows values from 34.25 to 424.75. The y-axis shows values from 0.0846844116229388 to 3.49173031470251.