Edit chart
Loading graph
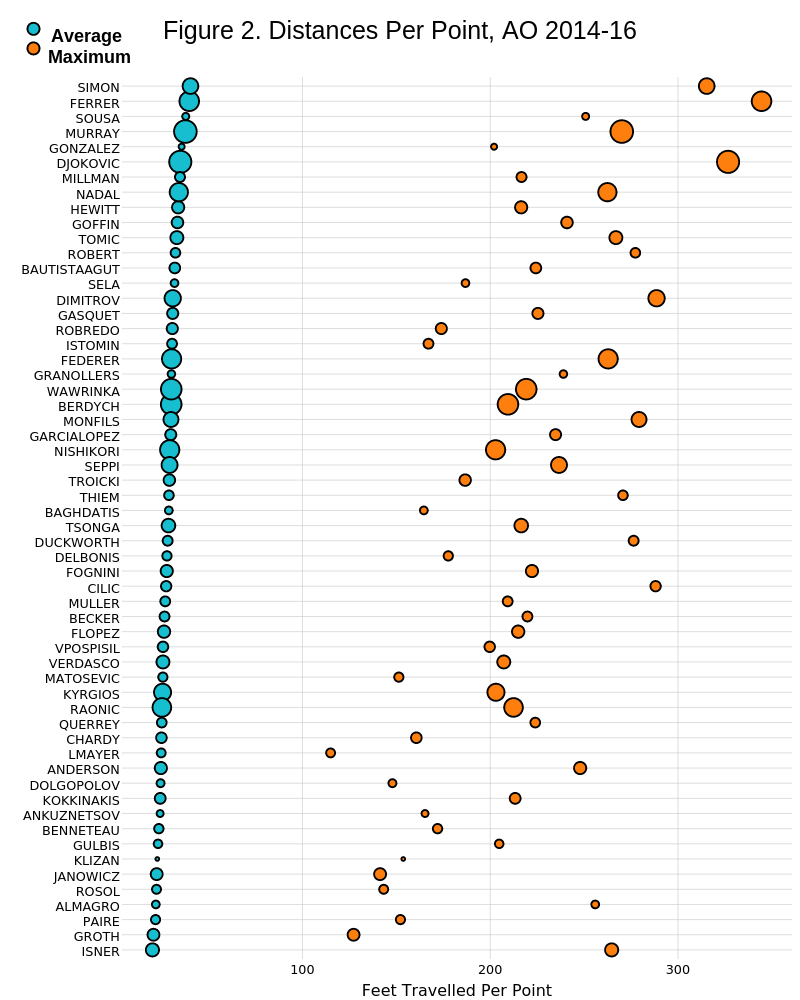
On-the-t's interactive graph and data of "Figure 2. Distances Per Point, AO 2014-16" is a scatter chart, showing vs ; with Feet Travelled Per Point in the x-axis. The x-axis shows values from 3.88716708195302 to 360.726389144914. The y-axis shows values from 0.4 to 58.6. This visualization has the following annotations: Average; Maximum