Edit chart
Loading graph
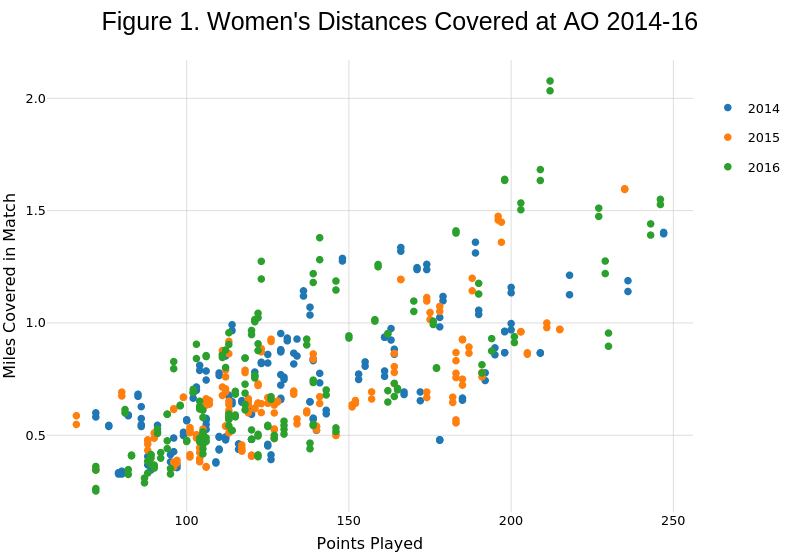
On-the-t's interactive graph and data of "Figure 1. Women's Distances Covered at AO 2014-16" is a scatter chart, showing 2014, 2015, 2016, 2014, 2015, 2016; with Points Played in the x-axis and Miles Covered in Match in the y-axis.. The x-axis shows values from 56.95 to 256.05. The y-axis shows values from 0.16061246953482 to 2.16858368914312.