Edit chart
Loading graph
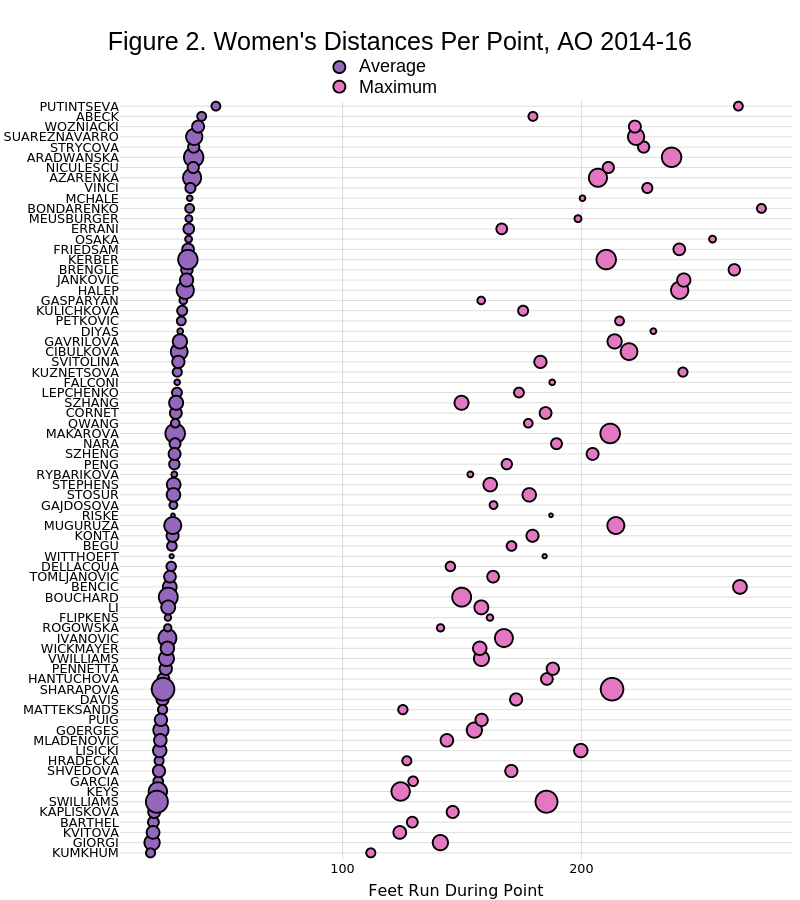
On-the-t's interactive graph and data of "Figure 2. Women's Distances Per Point, AO 2014-16" is a scatter chart, showing vs ; with Feet Run During Point in the x-axis. The x-axis shows values from 6.78322635258623 to 288.148143755343. The y-axis shows values from 0.4 to 74.6. This visualization has the following annotations: Average; Maximum