Edit chart
Loading graph
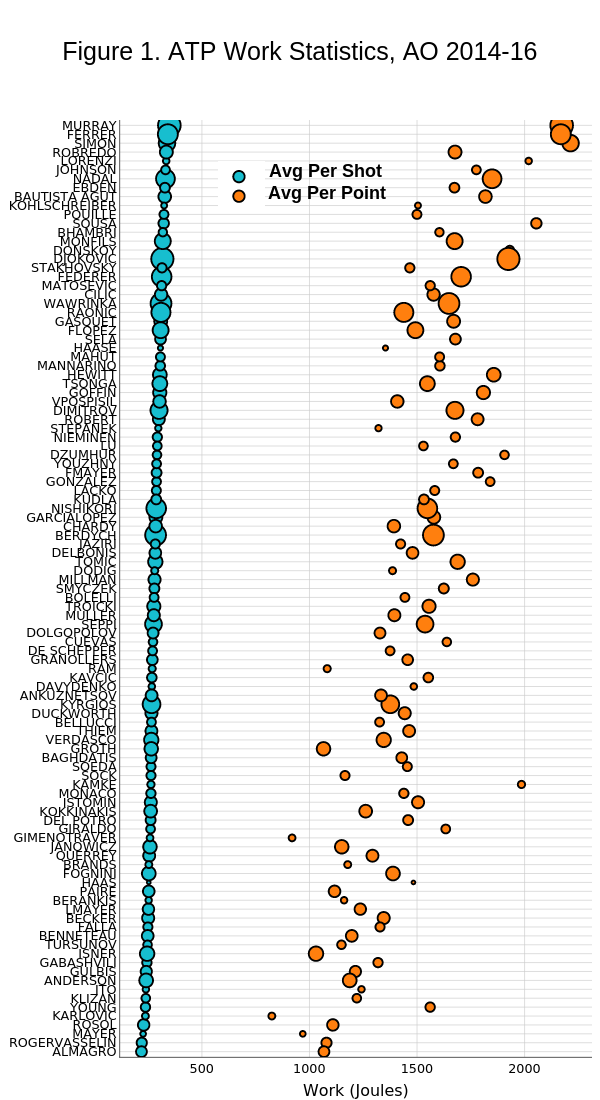
On-the-t's interactive graph and data of "Figure 1. ATP Work Statistics, AO 2014-16" is a scatter chart, showing vs ; with Work (Joules) in the x-axis. The x-axis shows values from 119.1806 to 2313.4914. The y-axis shows values from 0.4 to 105.6. This visualization has the following annotations: Avg Per Shot; Avg Per Point