Edit chart
Loading graph
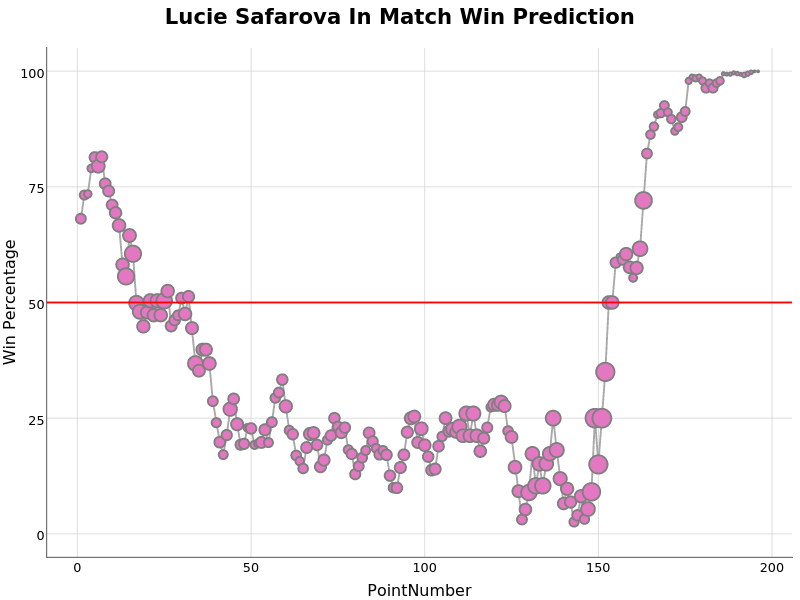
On-the-t's interactive graph and data of "Lucie Safarova In Match Win Prediction" is a line chart, showing , , , ; with PointNumber in the x-axis and Win Percentage in the y-axis.. The x-axis shows values from -8.75 to 205.75. The y-axis shows values from -5 to 105.