Edit chart
Loading graph
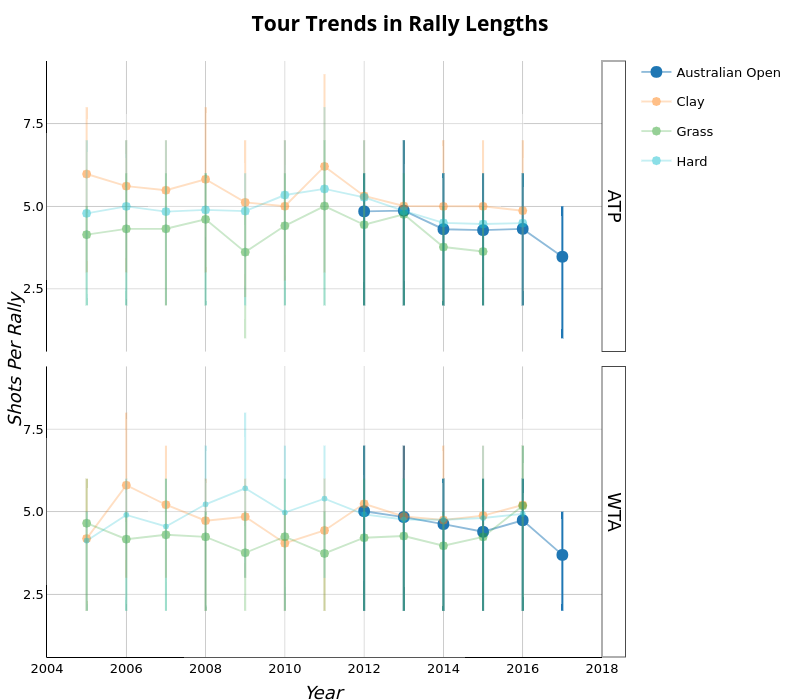
On-the-t's interactive graph and data of "Tour Trends in Rally Lengths" is a , showing Australian Open, Australian Open, Clay, Clay, Grass, Grass, Hard, Hard. The x-axis shows values from 2004 to 2018. The y-axis shows values from 0.6 to 9.4. This visualization has the following annotations: Year; <i>Shots Per Rally</i>; ATP; WTA