Edit chart
Loading graph
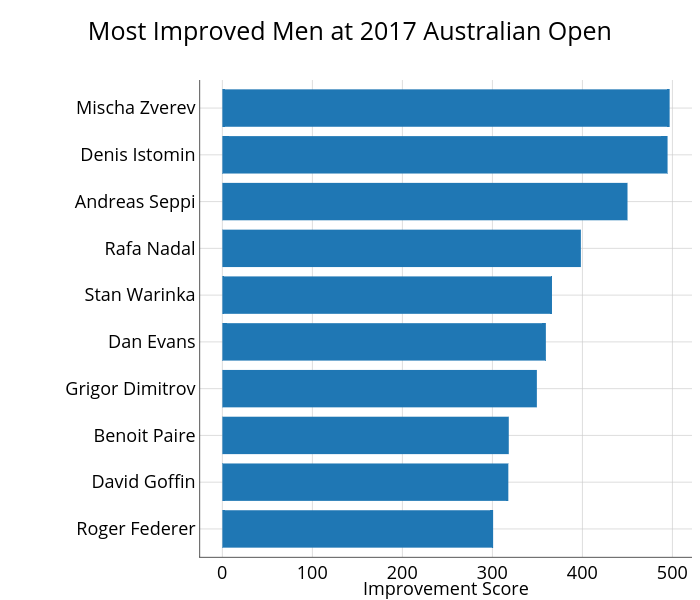
On-the-t's interactive graph and data of "Most Improved Men at 2017 Australian Open" is a bar chart; with Improvement Score in the x-axis. The x-axis shows values from -24.845 to 521.745. The y-axis shows values from 0.4 to 10.6.