Edit chart
Loading graph
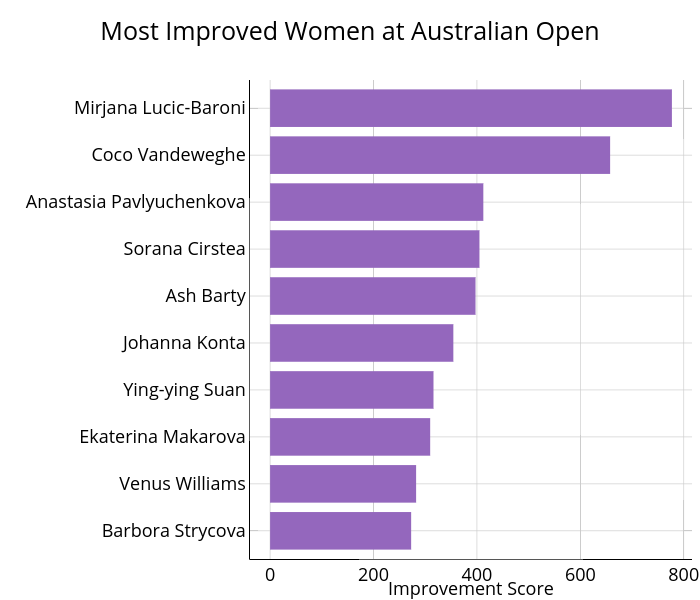
On-the-t's interactive graph and data of "Most Improved Women at Australian Open" is a bar chart; with Improvement Score in the x-axis. The x-axis shows values from -38.855 to 815.955. The y-axis shows values from 0.4 to 10.6.