Edit chart
Loading graph
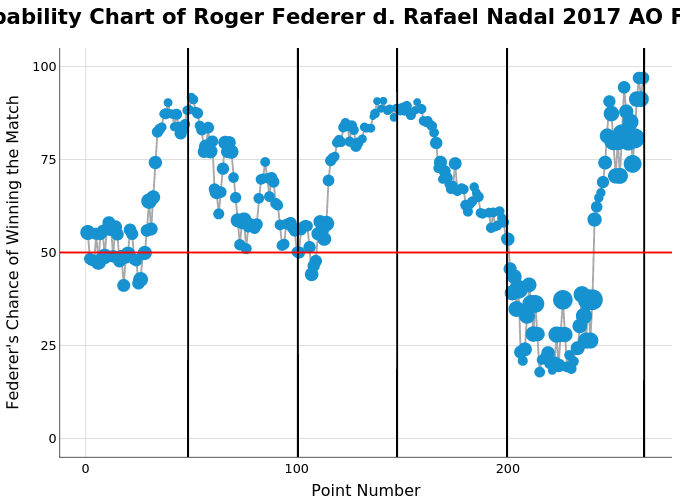
On-the-t's interactive graph and data of " Probability Chart of Roger Federer d. Rafael Nadal 2017 AO Final " is a line chart, showing , , , , ; with Point Number in the x-axis and Federer's Chance of Winning the Match in the y-axis.. The x-axis shows values from -12.175 to 277.675. The y-axis shows values from -5 to 105.