Edit chart
Loading graph
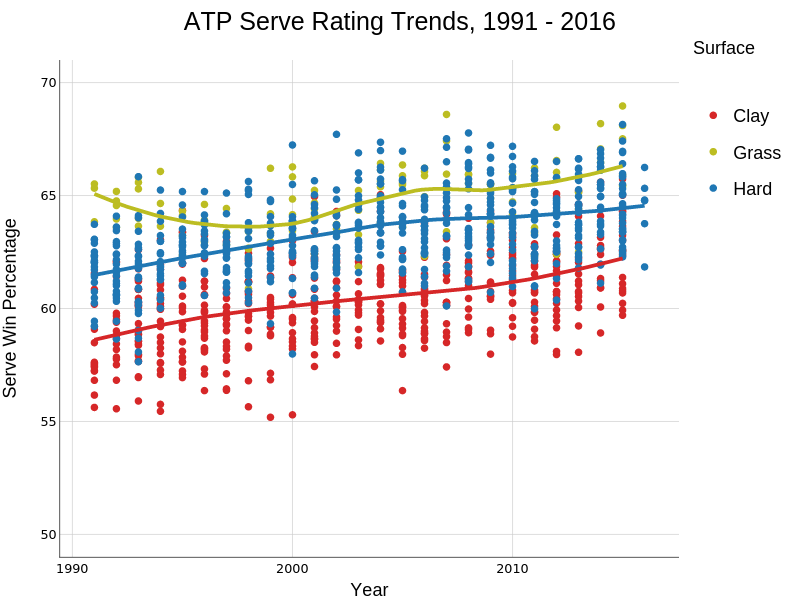
On-the-t's interactive graph and data of "ATP Serve Rating Trends, 1991 - 2016" is a scatter chart, showing Clay, Grass, Hard, Clay, Grass, Hard, Clay, Grass, Hard; with Year in the x-axis and Serve Win Percentage in the y-axis.. The x-axis shows values from 1989.4372805389025 to 2017.5627194610975. The y-axis shows values from 49 to 71. This visualization has the following annotation: Surface