Edit chart
Loading graph
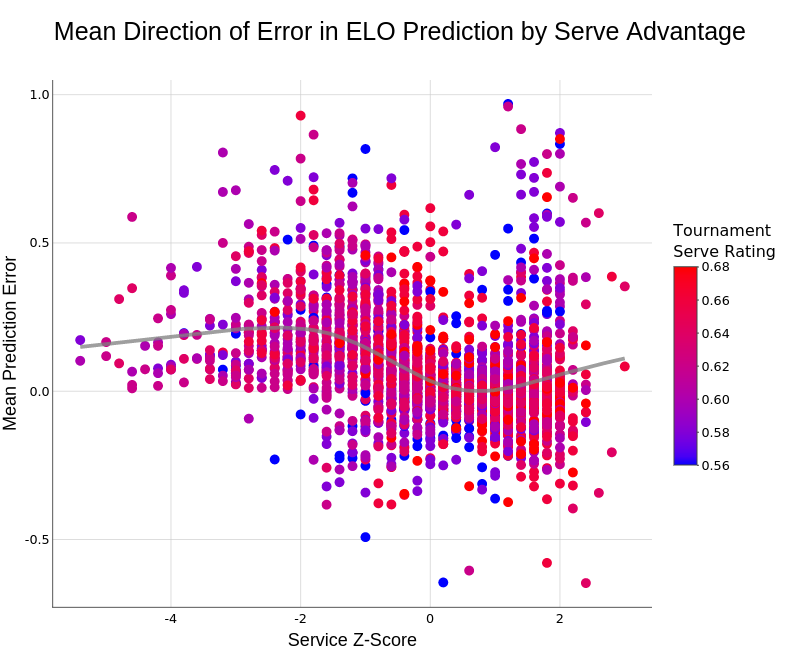
On-the-t's interactive graph and data of "Mean Direction of Error in ELO Prediction by Serve Advantage" is a scatter chart, showing , fitted values, , 99_5aadbe5fc595692c43f077f3480e5ed4; with Service Z-Score in the x-axis and Mean Prediction Error in the y-axis.. The x-axis shows values from -5.82 to 3.42. The y-axis shows values from -0.727525797942894 to 1.04943618507101.