Edit chart
Loading graph
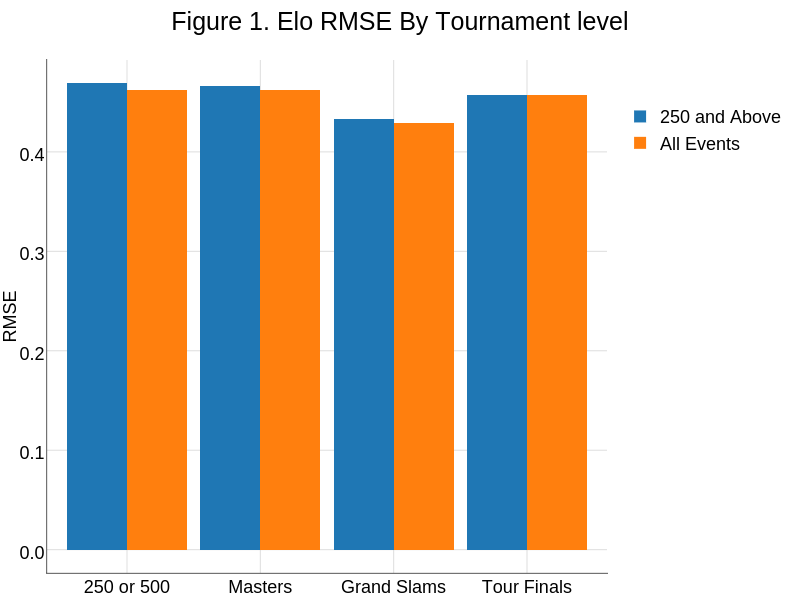
On-the-t's interactive graph and data of "Figure 1. Elo RMSE By Tournament level" is a stacked bar chart, showing All Events vs 250 and Above; with RMSE in the y-axis. The x-axis shows values from 0.4 to 4.6. The y-axis shows values from -0.0234472857008905 to 0.4923929997187.