Edit chart
Loading graph
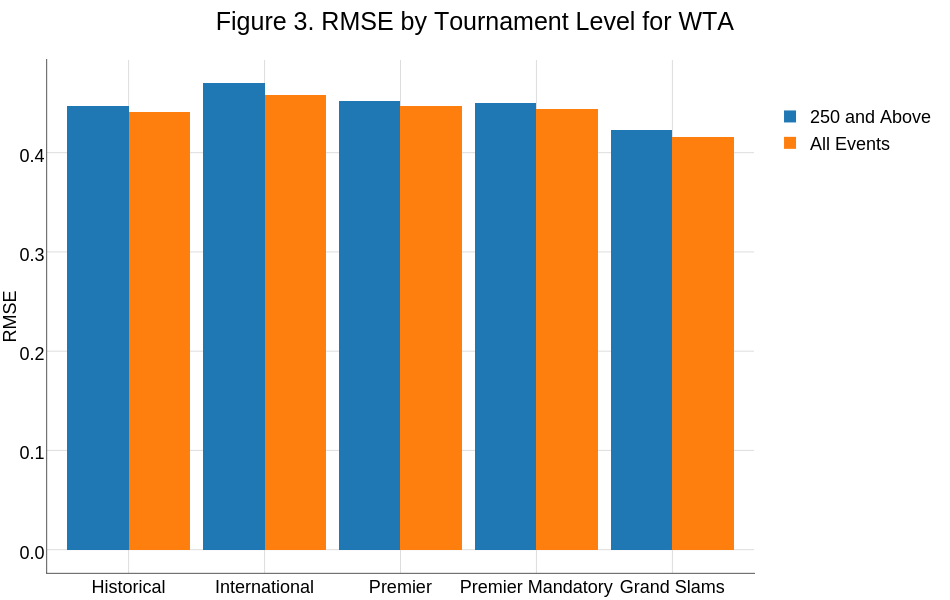
On-the-t's interactive graph and data of "Figure 3. RMSE by Tournament Level for WTA" is a stacked bar chart, showing All Events vs 250 and Above; with RMSE in the y-axis. The x-axis shows values from 0.4 to 5.6. The y-axis shows values from -0.0234918137470748 to 0.493328088688571.