Edit chart
Loading graph
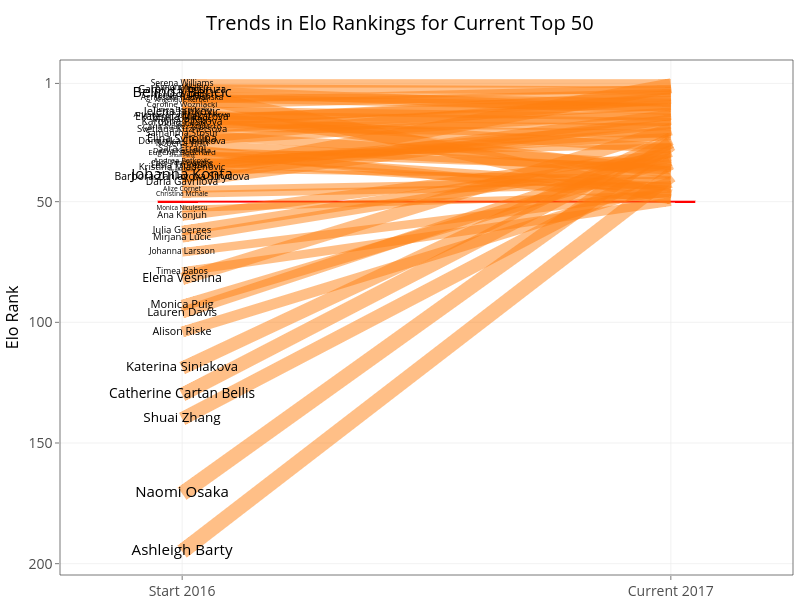
On-the-t's interactive graph and data of "Trends in Elo Rankings for Current Top 50" is a line chart, showing , , , , , , , , , , , , , , , , , , , , , , , , , , , , , , , , , , , , , , , , , , , , , , , , , , , ; with Elo Rank in the y-axis. The x-axis shows values from 2015.75 to 2017.25. The y-axis shows values from -204.7 to 8.7.