Edit chart
Loading graph
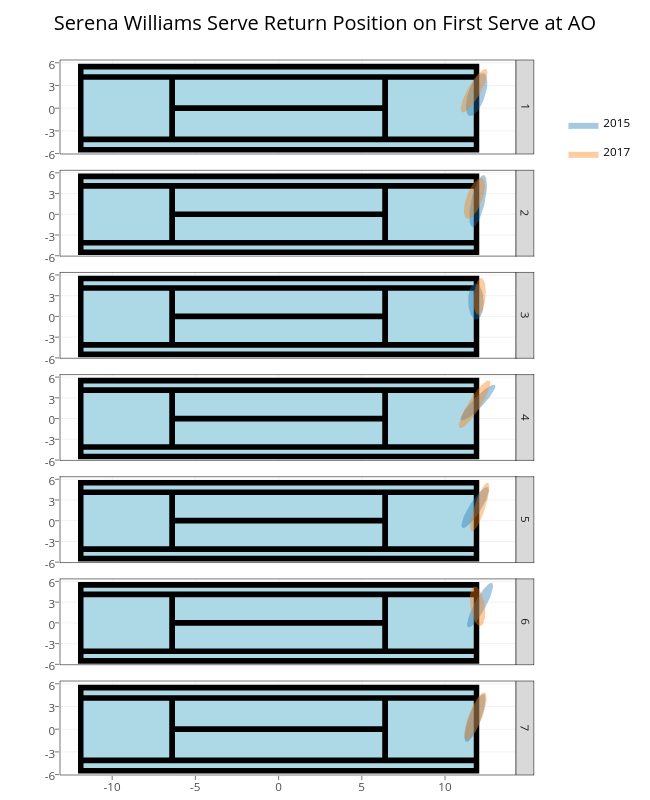
On-the-t's interactive graph and data of "Serena Williams Serve Return Position on First Serve at AO" is a filled line chart, showing [], [], [], [], [], [], [], [], [], [], [], [], [], [], [], [], [], [], [], [], [], 2015, 2015, 2015, 2015, 2015, 2015, 2015, 2017, 2017, 2017, 2017, 2017, 2017, 2017. The x-axis shows values from -13.1354910086904 to 14.2653111824991. The y-axis shows values from -6.05438690084392 to 6.36212491772224. This visualization has the following annotations: 1; 2; 3; 4; 5; 6; 7