Edit chart
Loading graph
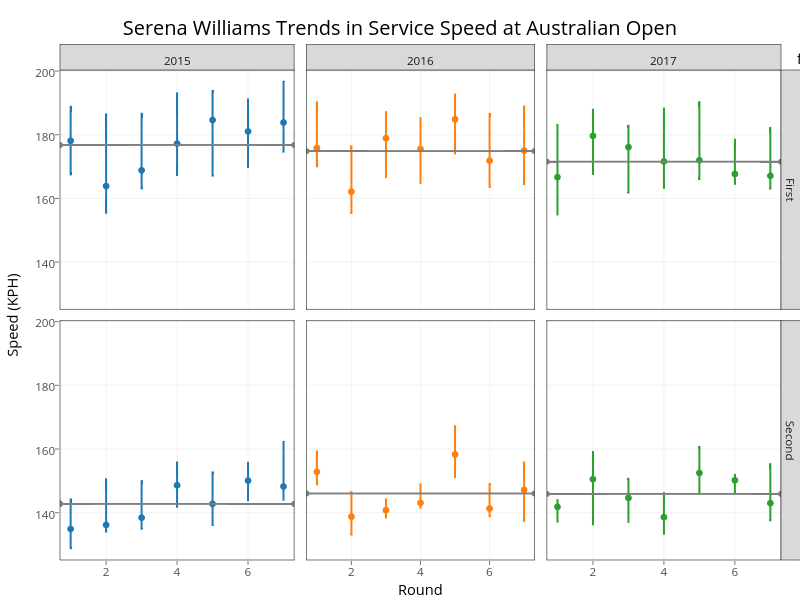
On-the-t's interactive graph and data of "Serena Williams Trends in Service Speed at Australian Open" is a , showing 2015, 2015, 2016, 2016, 2017, 2017, [], [], [], [], [], []. The x-axis shows values from 0.7 to 7.3. The y-axis shows values from 125.139195929098 to 200.328141902558. This visualization has the following annotations: Round; Speed (KPH); 2015; 2016; 2017; First; Second; factor(year)