Edit chart
Loading graph
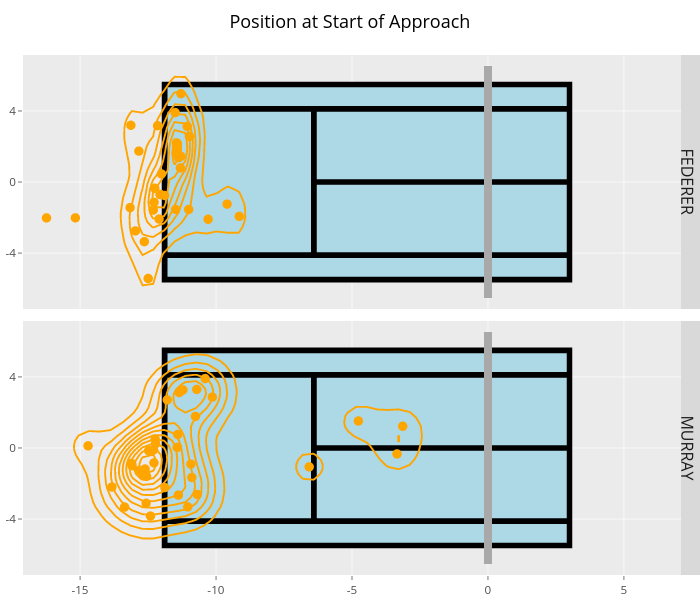
On-the-t's interactive graph and data of "Position at Start of Approach" is a filled line chart, showing [], [], [], [], [], [], [], [], [], [], [], []. The x-axis shows values from -17.1 to 7.1. The y-axis shows values from -7.15 to 7.15. This visualization has the following annotations: FEDERER; MURRAY