Edit chart
Loading graph
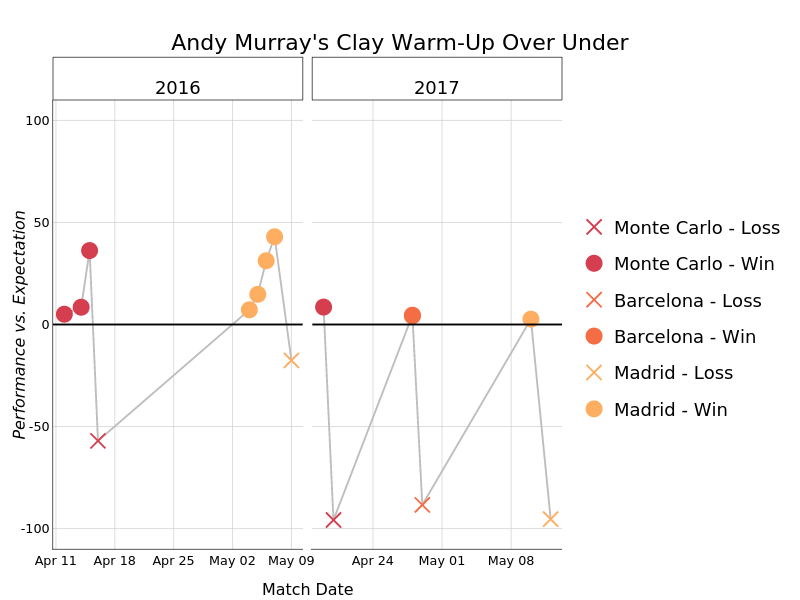
On-the-t's interactive graph and data of "Andy Murray's Clay Warm-Up Over Under" is a line chart, showing , , Monte Carlo - Loss, (Monte Carlo,Lost), Monte Carlo - Win, (Monte Carlo,Won), Barcelona - Loss, Barcelona - Win, Madrid - Loss, (Madrid,Lost), Madrid - Win, (Madrid,Won), (Monte Carlo,1), (Monte Carlo,2), (Barcelona,2), (Madrid,1), (Madrid,2), , . The x-axis shows values from 1460302560000 to 1462868640000. The y-axis shows values from -110 to 110. This visualization has the following annotations: Match Date; Performance vs. Expectation ; 2016; 2017;