Edit chart
Loading graph
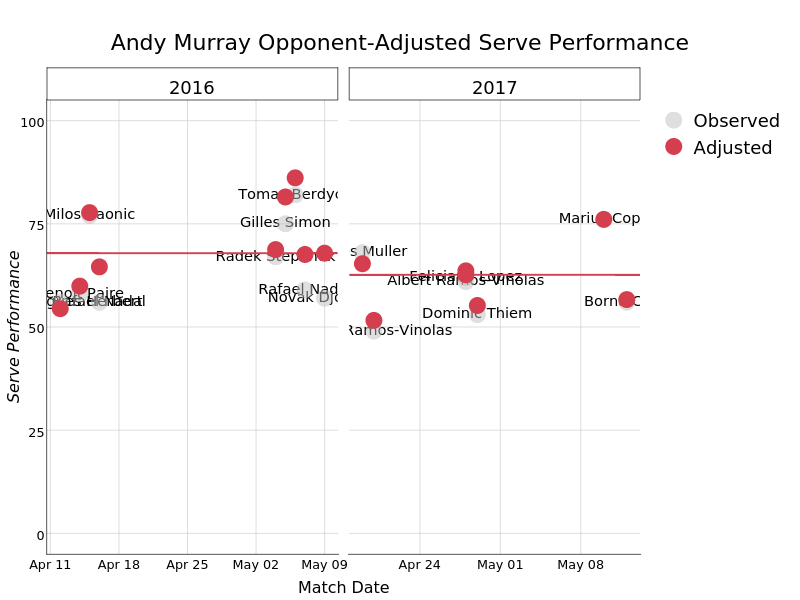
On-the-t's interactive graph and data of "Andy Murray Opponent-Adjusted Serve Performance" is a , showing [], [], [], Observed, [], Adjusted, [], []. The x-axis shows values from 1460302560000 to 1462868640000. The y-axis shows values from -5 to 105. This visualization has the following annotations: Match Date; Serve Performance ; 2016; 2017