Edit chart
Loading graph
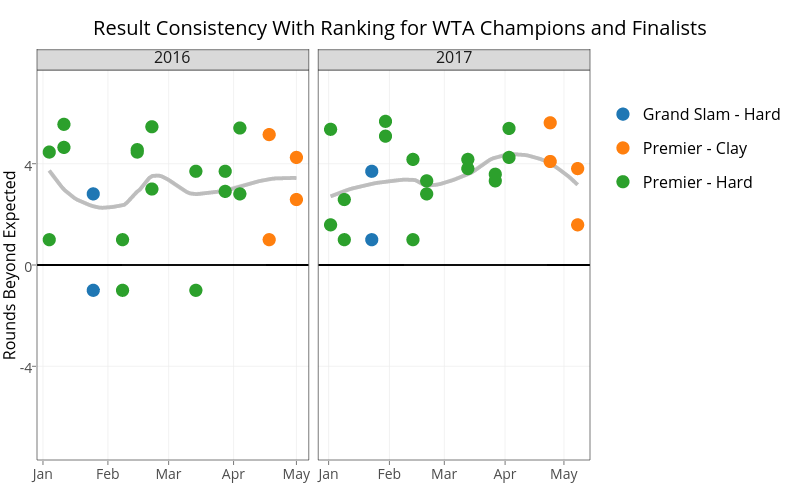
On-the-t's interactive graph and data of "Result Consistency With Ranking for WTA Champions and Finalists" is a , showing Grand Slam - Hard, Grand Slam - Hard, Premier - Clay, Premier - Clay, Premier - Hard, Premier - Hard, fitted values, fitted values, , , Grand Slam - Hard, Grand Slam - Hard, Premier - Clay, Premier - Clay, Premier - Hard, Premier - Hard, , . The x-axis shows values from 1451360000000 to 1462570560000. The y-axis shows values from -7.7 to 7.7. This visualization has the following annotations: Rounds Beyond Expected; 2016; 2017