Edit chart
Loading graph
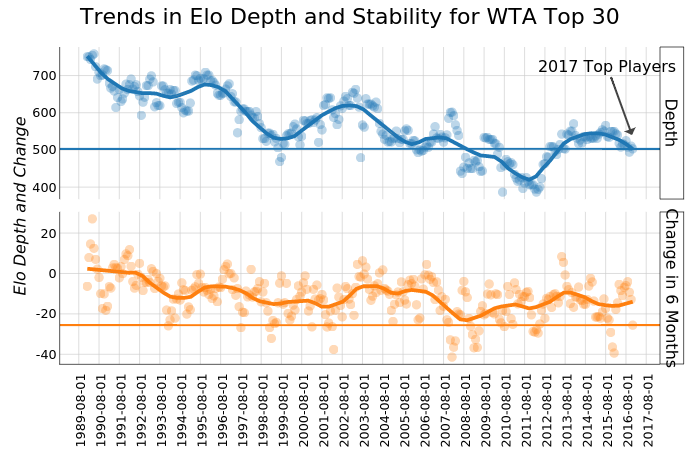
On-the-t's interactive graph and data of "Trends in Elo Depth and Stability for WTA Top 30" is a line chart, showing median, median.change, median, median.change, median, median.change, median, median.change. The x-axis shows values from 588682080000 to 1523020320000. The y-axis shows values from 367.944177493305 to 776.78239109758. This visualization has the following annotations: Elo Depth and Change; Depth; Change in 6 Months; 2017 Top Players