Edit chart
Loading graph
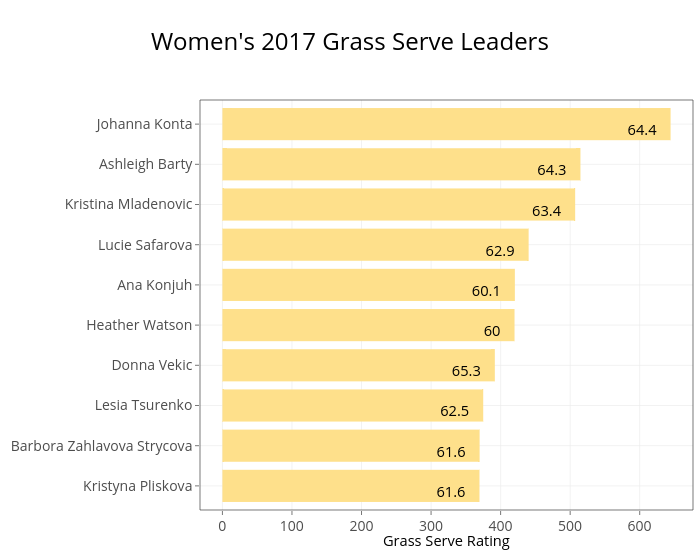
On-the-t's interactive graph and data of "Women's 2017 Grass Serve Leaders" is a stacked bar chart, showing [] vs []; with Grass Serve Rating in the x-axis. The x-axis shows values from -32.22 to 676.62. The y-axis shows values from 0.4 to 10.6.