Edit chart
Loading graph
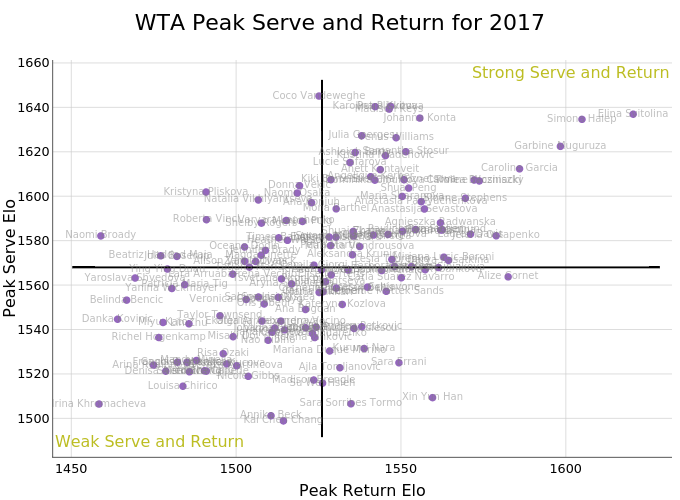
On-the-t's interactive graph and data of "WTA Peak Serve and Return for 2017" is a scatter chart; with Peak Return Elo in the x-axis and Peak Serve Elo in the y-axis.. The x-axis shows values from 1448.244872901948 to 1630.587239657472. The y-axis shows values from 1482.6025243922056 to 1661.3190822308943. This visualization has the following annotations: Strong Serve and Return; Weak Serve and Return