Edit chart
Loading graph
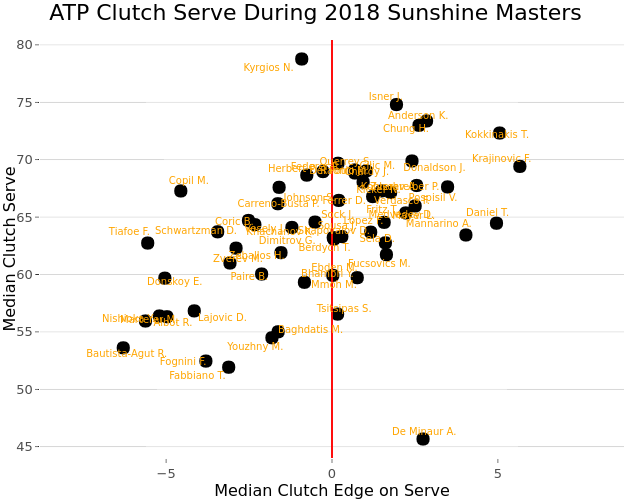
On-the-t's interactive graph and data of "ATP Clutch Serve During 2018 Sunshine Masters" is a scatter chart; with Median Clutch Edge on Serve in the x-axis and Median Clutch Serve in the y-axis.. The x-axis shows values from -8.8 to 8.8. The y-axis shows values from 44.0164706021184 to 80.4254270423017.