Edit chart
Loading graph
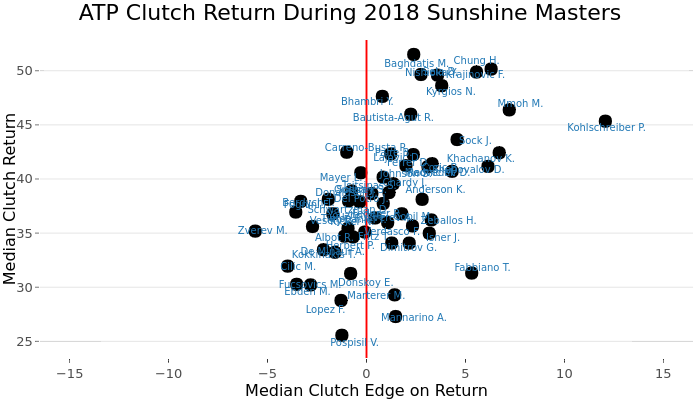
On-the-t's interactive graph and data of "ATP Clutch Return During 2018 Sunshine Masters" is a scatter chart; with Median Clutch Edge on Return in the x-axis and Median Clutch Return in the y-axis.. The x-axis shows values from -16.5 to 16.5. The y-axis shows values from 23.4498192042843 to 52.8501744172952.