Edit chart
Loading graph
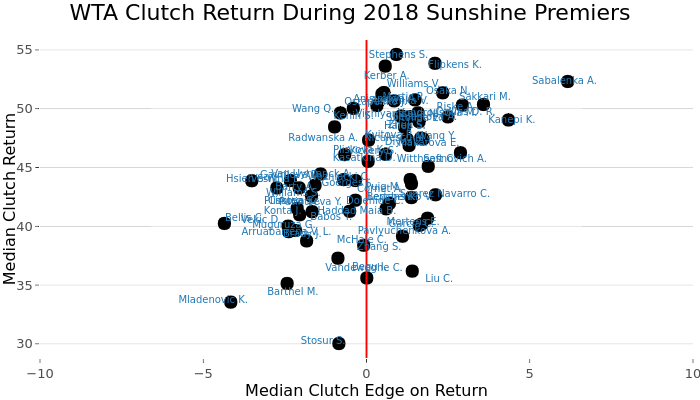
On-the-t's interactive graph and data of "WTA Clutch Return During 2018 Sunshine Premiers" is a scatter chart; with Median Clutch Edge on Return in the x-axis and Median Clutch Return in the y-axis.. The x-axis shows values from -10 to 10. The y-axis shows values from 28.7952979925244 to 55.8455216266209.