Edit chart
Loading graph
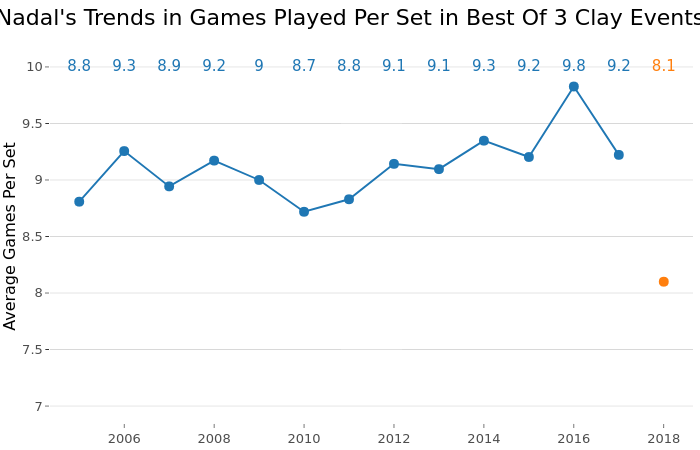
On-the-t's interactive graph and data of "Nadal's Trends in Games Played Per Set in Best Of 3 Clay Events" is a , showing FALSE, TRUE, FALSE, TRUE; with Average Games Per Set in the y-axis. The x-axis shows values from 2004.35 to 2018.65. The y-axis shows values from 6.85 to 10.15.