Edit chart
Loading graph
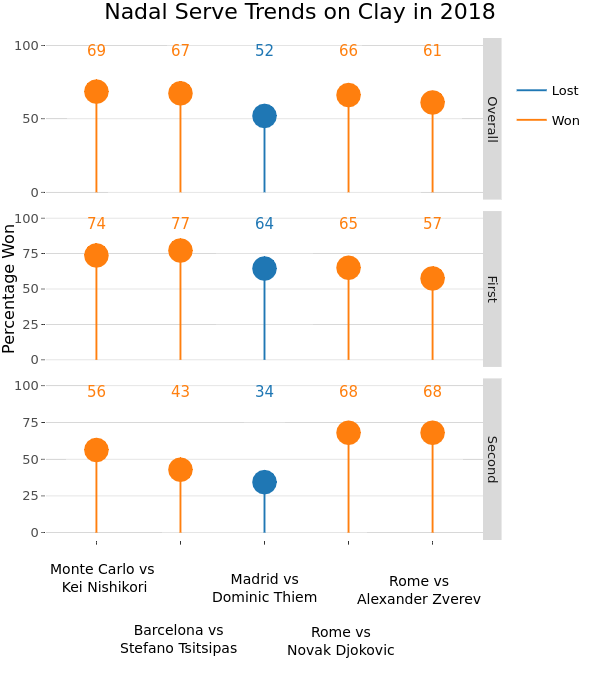
On-the-t's interactive graph and data of "Nadal Serve Trends on Clay in 2018" is a line chart, showing Lost, Lost, Lost, Won, Won, Won, Lost, Lost, Lost, Won, Won, Won, Lost, Lost, Lost, Won, Won, Won. The x-axis shows values from 0.4 to 5.6. The y-axis shows values from -5 to 105. This visualization has the following annotations: Percentage Won; Overall; First; Second; Monte Carlo vs<br> Kei Nishikori; Barcelona vs<br>Stefano Tsitsipas; Madrid vs<br>Dominic Thiem; Rome vs<br>Novak Djokovic; Rome vs<br>Alexander Zverev