Edit chart
Loading graph
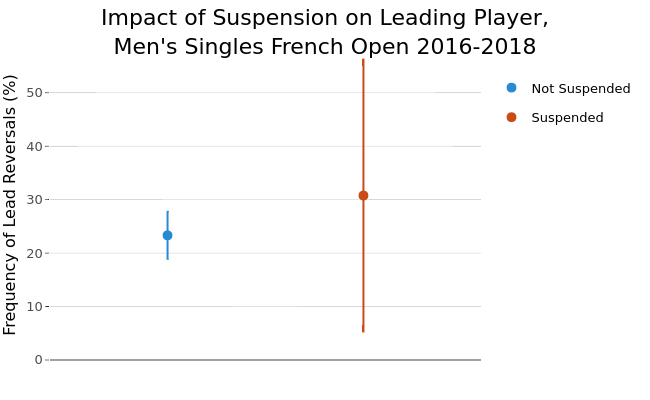
On-the-t's interactive graph and data of "Impact of Suspension on Leading Player,Men's Singles French Open 2016-2018" is a line chart, showing Not Suspended vs Suspended; with in the x-axis and Frequency of Lead Reversals (%) in the y-axis.. The x-axis shows values from 0.4 to 2.6. The y-axis shows values from 0 to 58.