Edit chart
Loading graph
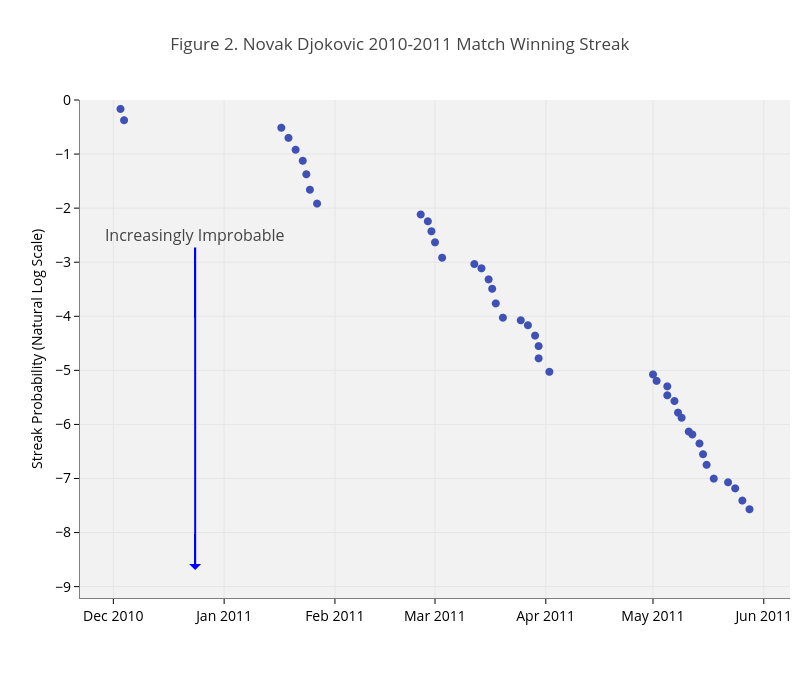
On-the-t's interactive graph and data of "Figure 2. Novak Djokovic 2010-2011 Match Winning Streak" is a scatter chart, showing None; with Streak Probability (Natural Log Scale) in the y-axis. The x-axis shows values from 1290384323370.4292 to 1307544876629.5708. The y-axis shows values from -9.21034037197618 to 0. This visualization has the following annotation: Increasingly Improbable