Edit chart
Loading graph
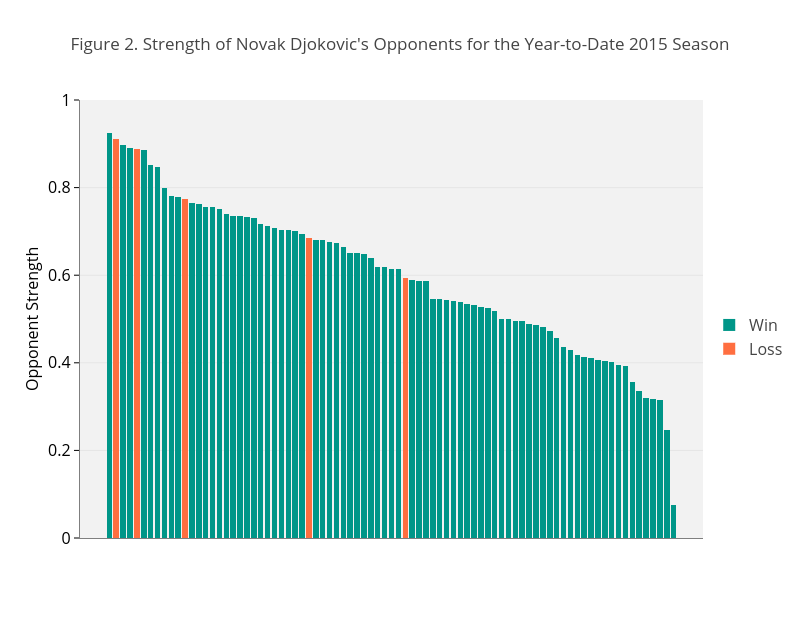
On-the-t's interactive graph and data of "Figure 2. Strength of Novak Djokovic's Opponents for the Year-to-Date 2015 Season" is a stacked bar chart, showing Loss vs Win; with Opponent Strength in the y-axis. The x-axis shows values from -3.2650000000000006 to 87.265. The y-axis shows values from 0 to 1. This visualization has the following annotation: