Edit chart
Loading graph
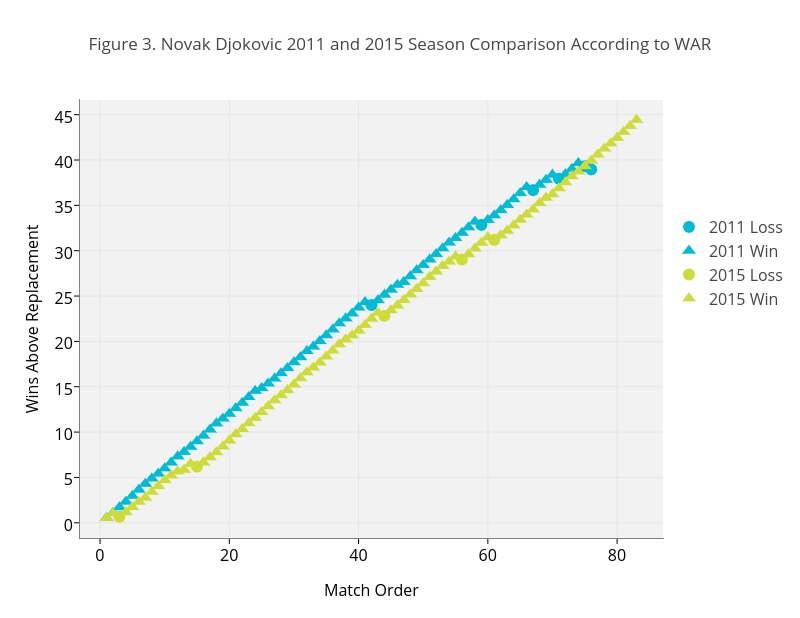
On-the-t's interactive graph and data of "Figure 3. Novak Djokovic 2011 and 2015 Season Comparison According to WAR" is a line chart, showing 2011.Loss, 2011.Win, 2015.Loss, 2015.Win, 2011 Loss, 2011 Win, 2015 Loss, 2015 Win; with Match Order in the x-axis and Wins Above Replacement in the y-axis.. The x-axis shows values from -3.0999999999999996 to 87.1. The y-axis shows values from -1.6773459865265998 to 46.616238710026. This visualization has the following annotation: